
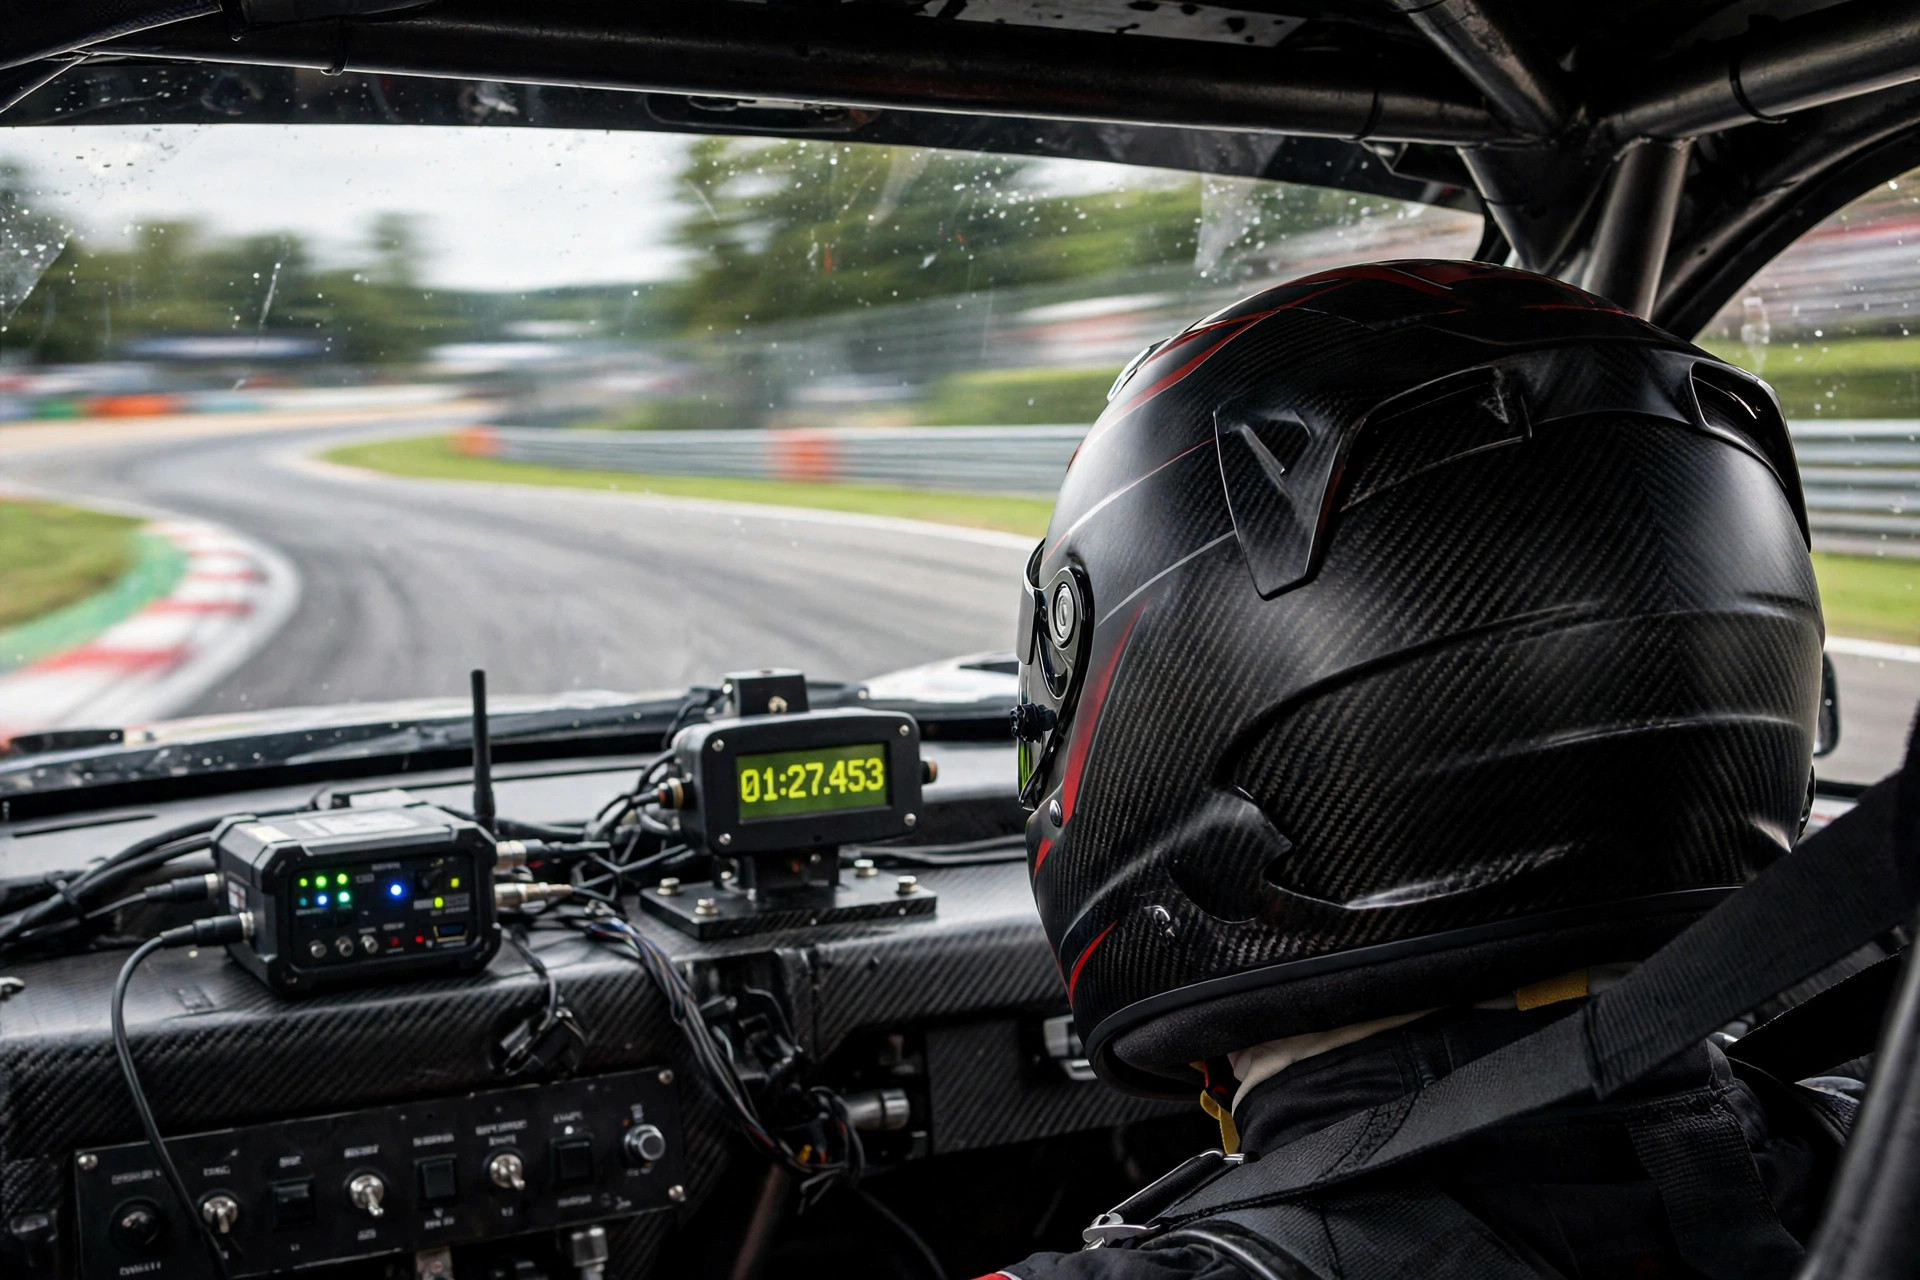
Why Data Beats Feelings
If you want to know how lap timers and data logging can actually make you faster on track, this guide walks through it step by step. It explains what telemetry records, why the numbers reveal more than feel alone, and how drivers use speed traces, sectors, and video between sessions to decide what to change next. Whether you start with a phone app or a dedicated logger, knowing who is gaining time, where on the lap, and why is what turns laps into learning.
Drivers are unreliable narrators of their own performance. You will swear you braked at the same marker every lap, that you were flat through the kink, that the car understeered in turn three. Data tells you what actually happened: you braked ten meters earlier on laps four through seven, you lifted slightly in the kink every time, and the steering trace shows you added lock mid-corner because your line was wrong.
This gap between perception and reality is why data logging is the fastest legal performance upgrade in track driving. It does not make the car faster; it makes you honest, and honesty is what makes you faster.
Data also compresses learning time enormously
Data also compresses learning time enormously. Without data, improving means guessing what changed between a good lap and a bad lap, and human memory of a twenty-minute session is hopelessly fuzzy. With data, you overlay your best lap against your average lap and see exactly where the time came from: later braking into turn one, more minimum speed through turn five, earlier throttle in turn nine.
Each insight becomes a specific task for the next session instead of a vague resolution to try harder. Beginners sometimes assume data is only for fast drivers, but the opposite is true: beginners gain the most because they have the most low-hanging fruit.
Lap Timers: The Simplest Starting Point
A lap timer does one thing: it tells you your lap time. That single number, tracked session over session, is the foundation of all performance measurement. Dedicated lap timers use GPS to detect the start-finish line automatically and display your times in real time on a small dashboard unit. Seeing your times live changes your driving immediately; you start connecting specific corners to specific gains and losses, and consistency becomes a visible, measurable goal rather than a vague feeling.
Even without hardware, timing matters. Many drivers start by having a friend time laps with a stopwatch, which is crude but still useful for tracking progress across a day. The key discipline is recording the numbers: write down every session’s best and typical times along with notes on conditions and changes you made.
A notebook of lap times across events is a surprisingly powerful tool, revealing trends like steady improvement at familiar tracks and plateaus that signal it is time for coaching or a new technique. Whatever you use, the rule is the same: if you are not measuring, you are guessing.
Phone Apps That Log Your Laps
Modern smartphones are remarkably capable data loggers. Apps use the phone’s GPS to track position around the circuit, automatically detect laps, and record speed, line, and sector times. Mounted securely on the dashboard or windshield, a phone running a track app gives you lap times, a map of your driving line, speed traces, and predictive lap timing that shows whether your current lap is up or down on your best. For a first step into data, this is unbeatable value: the hardware is already in your pocket.
Phone GPS accuracy has limits. Consumer phone GPS samples at around one to ten hertz, which is adequate for lap times and line analysis but coarse for detailed technique work. External Bluetooth GPS receivers that sample at ten or twenty hertz dramatically improve accuracy and are a popular upgrade.
Phone apps also drain batteries quickly with the screen on, so bring a charger and a solid mount; a phone bouncing around the cabin produces garbage data and becomes a projectile. For choosing the right software and understanding what phone-based diagnostics can and cannot do, a guide to the best OBD2 and car apps helps you pick tools that fit your needs.
Dedicated Data Loggers
Dedicated data loggers are purpose-built units that record GPS position, acceleration, and vehicle data at high sample rates with far greater accuracy than phones. Entry-level units combine GPS lap timing with accelerometers to show braking force, cornering loads, and speed traces. Mid-range systems add video integration and more channels. Professional systems sample at hundreds of hertz across dozens of channels including suspension travel, steering angle, and brake pressure, but that level is overkill for HPDE.
For most track day drivers, the sweet spot is a logger with ten-hertz GPS or better, three-axis accelerometers, and the ability to pull data from the car’s OBD2 port. This combination captures everything needed to analyze lines, braking points, and corner speeds without the complexity of a full motorsport installation. The software matters as much as the hardware: good analysis software makes it easy to overlay laps, compare sectors, and visualize the track map with speed coloring.
Bad software turns valuable data into an unreadable chore. Read reviews from track drivers, not just product pages, before buying.
OBD2 and CAN Bus Data
Your car’s computer already knows a great deal about what is happening: throttle position, rpm, coolant temperature, and on many cars, brake pressure, steering angle, and wheel speeds. Tapping this data through the OBD2 port adds a rich layer to GPS-based logging. Seeing throttle and brake traces alongside speed reveals habits you cannot feel: the slight lift you did not know you were doing, the delayed throttle application costing you exit speed, the braking that started strong then trailed off too early.
OBD2 data rates vary by car; some stream quickly, others frustratingly slowly, and the available parameters differ by manufacturer. Bluetooth and WiFi OBD2 adapters paired with logging apps are the easy entry point, while dedicated loggers with CAN bus interfaces pull data faster and more reliably. Understanding what the data means requires some learning: a primer on OBD2 scanners explains the fundamentals, live data PIDs explained decodes the parameters, and choosing an OBD2 scanner helps you pick hardware that works with logging software rather than against it.
For wider background reading, the overview of telemetry explains the broader idea of measuring and transmitting data from a distance.
Video With Data Overlay
Video synchronized with data is the most powerful learning combination available to track drivers. Watching your lap with speed, throttle, brake, and g-force displayed alongside the footage connects what you did with what you felt in a way that neither shows alone. You see the exact moment you lifted, hear the engine note change, and watch the speed trace dip, all simultaneously. Mistakes become undeniable and specific instead of vague memories.
Action cameras paired with data loggers or phone apps produce this automatically; the software syncs the video to the data by time or by GPS position. Mount cameras rigidly: suction mounts on glass work, but roll-bar or harness-bar mounts give steadier footage. Record every session, not just the ones you expect to be good, because the bad sessions teach the most. Review footage between sessions with your instructor when possible; a coach watching your data-overlay video spots issues in minutes that might take sessions to feel from the passenger seat.
Reading Your Data: What to Look For
Start with the basics: the speed trace around the full lap. Your best lap versus a typical lap, overlaid, shows exactly where time was gained or lost. Look first at minimum corner speeds, the slowest point in each turn, because higher minimum speed through corners is the foundation of fast laps.
- Minimum corner speeds, the slowest point in each turn.
- Braking zones: where braking started, how hard the initial application was, and whether braking trailed smoothly to the apex.
- Throttle application: how soon after the apex full throttle arrived, and whether it was progressive or sudden.
- Consistency across laps, seen by overlaying five laps and looking at how tightly the traces cluster.
Then look at braking zones: where braking started, how hard the initial application was, and whether braking trailed smoothly to the apex or ended abruptly. Then look at throttle application: how soon after the apex full throttle arrived, and whether it was progressive or sudden.
Next, examine consistency. Overlay five laps and look at how tightly the traces cluster. Big spreads in braking points or lines mean you are not repeating your technique, and no setup change or coaching can help until the basics repeat.
Sector times break the lap into segments, isolating which parts of the track need work; focus practice on your worst sector rather than the whole lap. Do not drown in channels at first. Speed, lap time, and line will keep you busy for a season; add throttle, brake, and g-force data as your analysis skills grow.
Turning Data Into Faster Laps
Data only helps if it changes what you do next session. The method is simple: pick the single biggest time loss from your analysis, form a specific plan to address it, execute the plan for the session, then check the data to see if it worked. If braking for turn one is ten meters earlier than your best lap showed was possible, the plan is to move the braking point two meters deeper each lap until the data confirms the gain. One change at a time, verified by data, is how methodical improvement works.
Share data with your instructor or coach. A good coach reads data fluently and will spot things you missed: the steering correction that reveals a line error three corners earlier, the throttle hesitation that indicates a confidence problem rather than a car problem. Comparing your data with a faster driver’s data in a similar car is the ultimate shortcut; the overlay shows precisely where they brake later, carry more speed, or apply throttle earlier, turning abstract advice into concrete targets. Data does not replace coaching, it supercharges it, giving both of you a shared, objective language for what is actually happening on track.
The Cost Ladder: From Free to Pro
Start free: a stopwatch and a notebook cost nothing and build the measurement habit. Step one is a phone app, free to a few dozen dollars, using hardware you own. Step two adds a ten-hertz Bluetooth GPS receiver for around a hundred dollars, dramatically improving phone-app accuracy.
Step three is a dedicated entry-level logger with OBD2 integration, a few hundred dollars, giving you professional-quality speed, line, and vehicle data. Step four adds video integration and more advanced software, approaching a thousand dollars all in.
Beyond that, returns diminish rapidly for
Beyond that, returns diminish rapidly for HPDE drivers. Professional multi-channel systems costing thousands are built for race teams chasing tenths with engineers analyzing the data. For a track day driver, the phone-to-entry-logger range captures ninety percent of the available insight.
Spend the savings on what actually makes you faster at this stage: more seat time and coaching. Data tells you what to fix, but only driving fixes it, and the best data system in the world cannot substitute for laps.
Related posts:

If this read fired you up, Track Day Instructors and Coaching: How to Get the Most From Your Coach keeps the Driving & Road Trips momentum rolling.
Share this with a fellow driver or enthusiast who needs to see it.

