
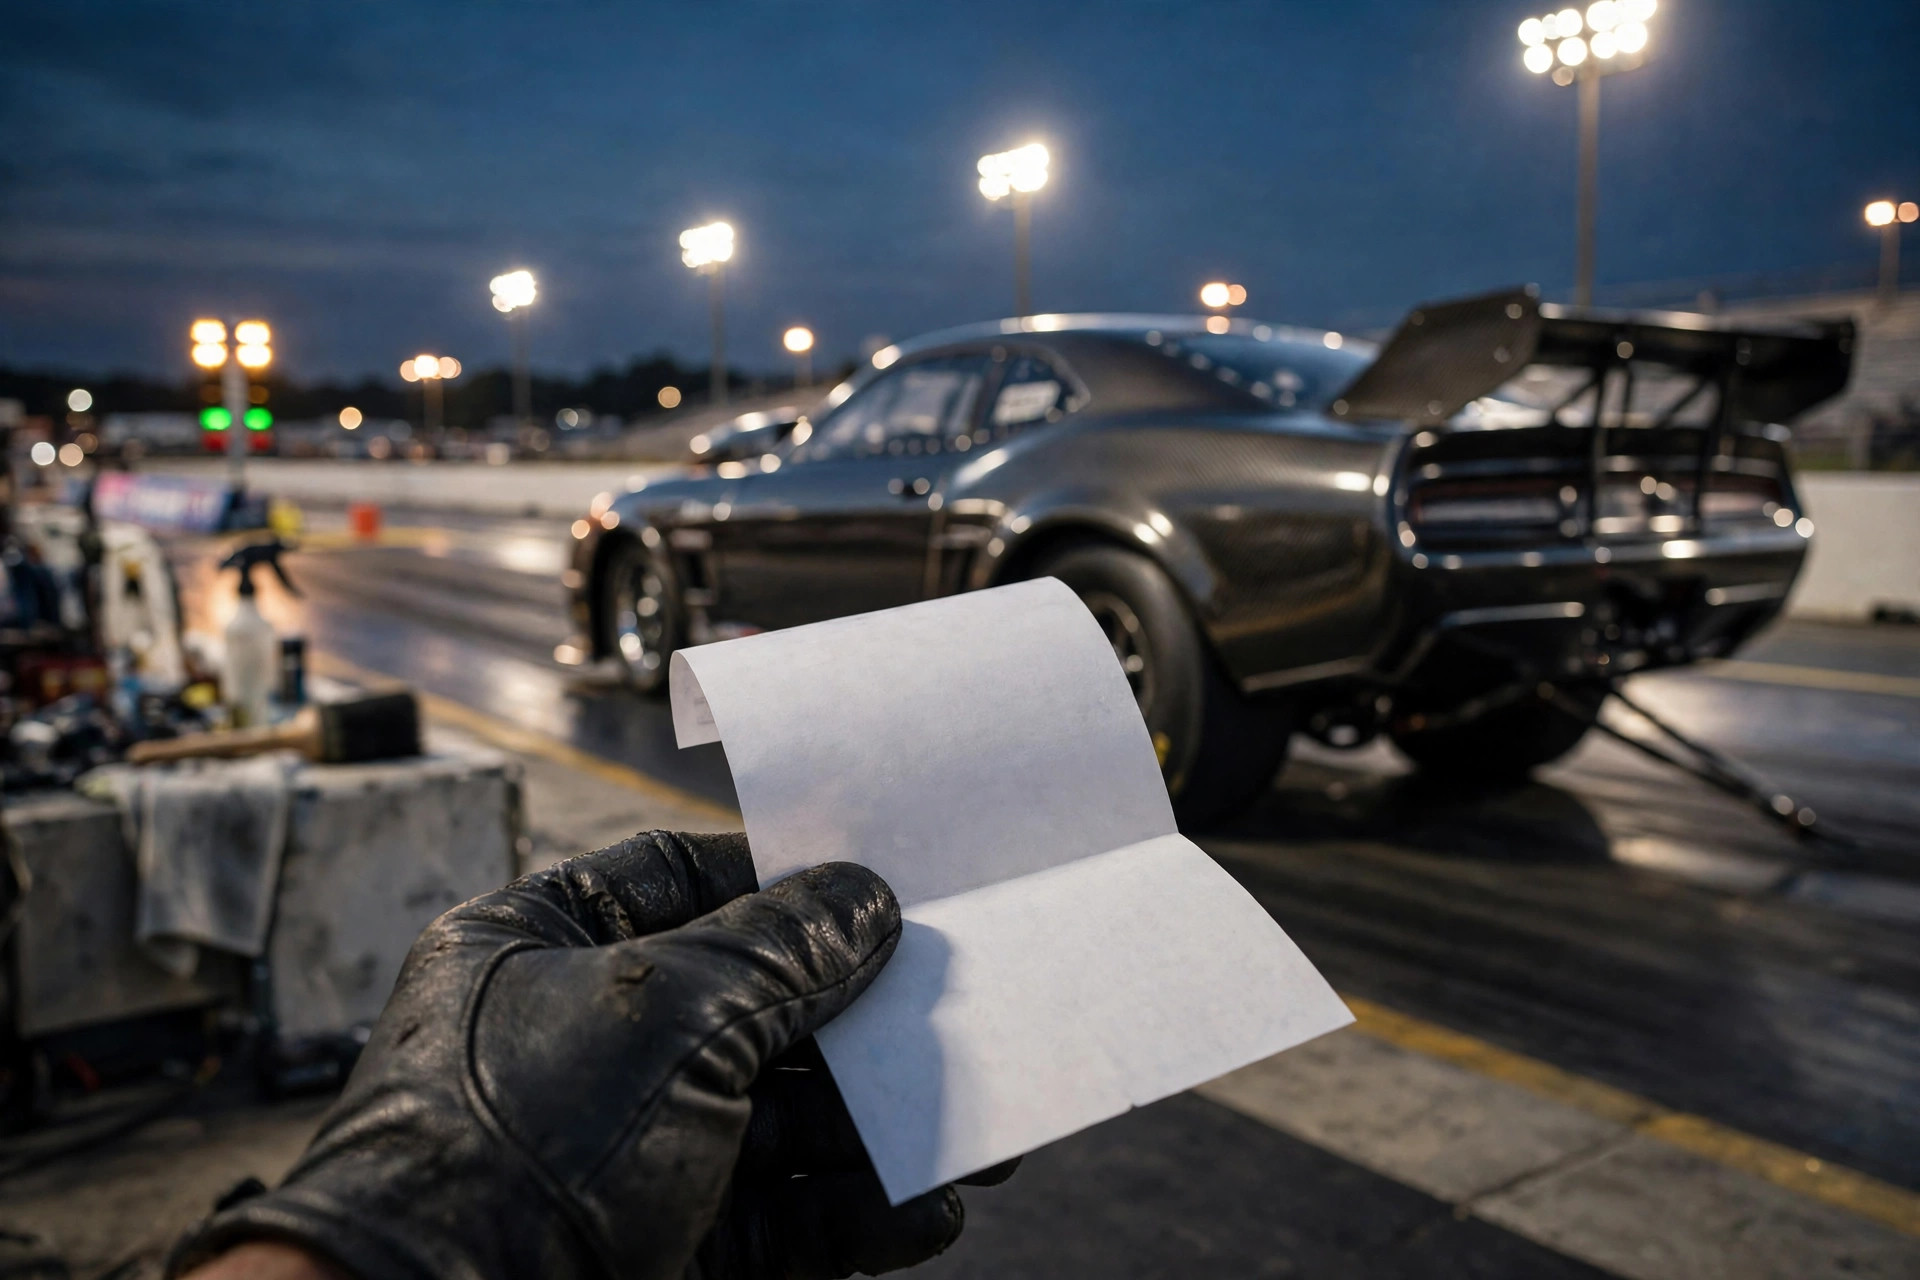
After every pass at the drag strip, the timing booth hands you a small printed slip, and learning how to read it tells you exactly what happened, when it happened, and why your car ran the number it did. This guide is for any racer, from first-timers to bracket regulars, who wants to know what each line means, where on the track it was recorded, and how to use it on the next run. The timeslip does not care about excuses, horsepower claims, or how fast the run felt. It records the run in hundredths and thousandths of a second, from the moment the tree ran to the moment you crossed the stripe.
Most beginners glance at the two big numbers, the elapsed time and the trap speed, and ignore the rest. That is like reading only the final score of a game and skipping the box score. The incremental times, the reaction time, and the relationship between ET and MPH contain the diagnosis of everything right and wrong with your run. This guide decodes every line of a standard timeslip, in order, so you can walk out of the timing booth knowing exactly what to work on next.
Anatomy of a Timeslip and Your Start
Anatomy of a Timeslip
A standard timeslip is laid out in two columns, one for each lane, headed by the lane numbers and usually the dial-ins in bracket racing. Your column shows your car number, your dial-in, and then the run data from top to bottom in the order it happened: reaction time first, then the incremental times at 60 feet, 330 feet, 660 feet (the eighth mile), and 1,000 feet, then the quarter-mile ET and the trap speed in MPH. Some tracks also print the eighth-mile ET and speed as a separate line, which is useful data even when you are running the full quarter.
The layout mirrors the physical track: each line corresponds to a timing block further down the strip, so reading top to bottom is reading the run chronologically. Keep every slip, because a single pass is a snapshot but a stack of slips is a trend, and trends are what reveal whether a change helped. Serious racers log each slip’s numbers alongside weather, lane, tire pressure, and launch RPM, building a database that eventually predicts their car’s behavior. The slip is free data; the racers who use it improve, and the ones who stuff it in the glovebox do not.
In practice, the core fields you will check after every pass are:
- Reaction time.
- 60-foot time.
- Incremental times at 330 feet, 660 feet (the eighth mile), and 1,000 feet.
- Quarter-mile ET and trap speed in MPH.
- Dial-in, breakout, and margin of victory in bracket racing.
Reaction Time: Your Start, Quantified
The first number is reaction time, the gap between your green light and your car breaking the stage beam. On a Sportsman tree, 0.500 is perfect and anything under it is a red light; competitive bracket racers live between 0.505 and 0.560. Your reaction time is entirely about you, not the car: it reflects your staging depth, your focus, and your timing on the tree. When this number is inconsistent, swinging from 0.52 to 0.64 across passes, the problem is routine and concentration, not reflexes.
Read this number in context with the rest of the slip. A great reaction with a slow ET means you did your job and the car did not, which points at setup or conditions. A poor reaction with a great ET means the car is strong but you are giving away the race at the tree, which is the cheapest problem to fix in drag racing.
In bracket racing, the reaction time is effectively added to your dial-in at the stripe, so a 0.05 advantage here is worth exactly as much as 0.05 of horsepower. Never dismiss a bad light as unimportant because the ET looked good.
The Launch and the Increments
60-Foot Time: The Launch Report Card
The 60-foot time measures how quickly you covered the first sixty feet, and it is the purest measure of your launch. For a street-tire car, anything under 2.0 seconds is respectable; a well-set-up street car on drag radials runs 1.6 to 1.8; and serious race cars dip into the 1.2s and below, with Top Fuel cars recording 60-foot times that seem physically impossible. Because early acceleration compounds, each tenth in the 60-foot is worth roughly a tenth and a half at the quarter-mile mark.
Diagnose with this number first. If your 60-foot is slow but the rest of the run looks normal, the problem is traction or launch technique: tire spin, bog, or a lazy clutch release. If the 60-foot is good but the back half of the run falls off, the problem is power or shifting, not the launch.
Compare 60-foot times across passes to evaluate changes: a tire pressure adjustment that drops the 60-foot by three hundredths is a real gain, even if changing weather masks it in the final ET. This number is also the fairest way to compare your driving against others, since it isolates the launch from horsepower.
330, 660, and 1,000 Feet: Reading the Increments
The incremental times at 330 feet, 660 feet (eighth mile), and 1,000 feet let you see where the run was won or lost. Think of them as checkpoints: if your 330-foot time is off but the 60-foot was fine, something happened early in the run, often a bad shift into second or brief wheelspin after the launch. If the increments are strong through the eighth mile but the quarter-mile ET disappoints, the car may be running out of gear or suffering in the top end, which points at gearing or aerodynamics rather than the launch.
The eighth-mile time deserves special attention because many street-car programs race the eighth mile outright, and because it is an excellent predictor of quarter-mile performance. A common estimator is that your quarter-mile ET is roughly 1.55 times your eighth-mile ET, though the exact factor varies with power and gearing. Racers also use the increments to spot mechanical issues: a sudden slowdown in one increment across consecutive passes can reveal a slipping clutch, a misfire under load, or a transmission problem long before it becomes obvious. When something feels off but you cannot name it, the increments usually can.
ET, MPH, and the Bracket Numbers
ET and MPH: The Headline Numbers
Elapsed time is the headline: how long your car took to cover the distance, measured from when your car broke the stage beam to when it broke the finish-line beam. Trap speed, the MPH figure, is measured over the final 66 feet before the finish line and represents your terminal velocity. Together they tell you about power and efficiency: ET reflects the whole run including the launch, while MPH is largely a function of power-to-weight, relatively independent of the launch. A car that traps high but ETs poorly is making power it cannot deploy, which screams traction or gearing problems.
The ET-to-MPH relationship is a powerful diagnostic. Online calculators can estimate your car’s horsepower from trap speed and weight with surprising accuracy, which is why experienced racers trust MPH as the power number and ET as the execution number. If your MPH climbs after a modification but your ET does not, the mod added power but your launch or shifting wastes it.
If both improve together, everything is working. And remember that ET is what wins bracket races against your dial-in, while MPH is just information, so do not chase trap speed at the expense of the launch. For broader background on how a dragstrip and its timing system are laid out, the track itself explains why the slip reads the way it does.
Dial-In, Breakout, and Margin of Victory
In bracket racing, the slip shows your dial-in alongside your ET, and the comparison is the whole game. Run quicker than the dial-in and you broke out, an automatic loss no matter how far ahead you finished. The slip also typically shows the margin of victory, often expressed as thousandths of a second at the stripe, which tells you how close the race really was. A win by 0.008 seconds is two car lengths at bracket speeds deciding nothing; it is a rounding error made visible.
Study the winner and loser designations alongside the numbers to learn the finish-line game. You will see races where the slower ET won because of a better reaction, races where both cars broke out and the lesser breakout took the win, and races decided by a red light despite a quicker run. Each of these teaches a lesson: the tree matters as much as the car, honesty in the dial-in beats optimism, and discipline beats aggression. New bracket racers should review every round’s slip, win or lose, because the numbers explain results that felt confusing from the driver’s seat.
Using Timeslip Data to Get Faster
Data becomes improvement through disciplined comparison. Change one variable at a time, launch RPM, tire pressure, shift point, and compare the relevant increment across passes in similar conditions. Weather-correct your ETs mentally or with a density-altitude calculator, because a 13.20 on a cool evening and a 13.35 on a hot afternoon may represent identical performance. The racers who improve fastest are not the ones with the most parts; they are the ones with the best notebooks, and a dyno session pairs beautifully with timeslip data by separating engine performance from chassis and driver execution.
Set process goals from the data rather than outcome goals. Instead of targeting an 11-second pass, target a 1.65 60-foot and three consecutive reactions under 0.560; the ET will follow. Share your slips with experienced racers and ask what they see, because a veteran can read a slip like a doctor reads a chart. And keep the historical record: a season of slips is a map of your progress as a driver and a tuner.
For general preparation that makes all of this easier, a beginner’s track day guide covers the mindset of structured practice that applies perfectly to test-and-tune nights. The timeslip is talking to you every pass; learning its language is the fastest free upgrade in the sport. Read it line by line, pass after pass, and the numbers will keep telling you exactly where the next improvement lives.
Related posts:


Finished here? The Burnout Explained: Technique, Purpose, and When It Actually Matters is the most natural next drive from this page.
Save this page and send it to your car group — good tips travel.

